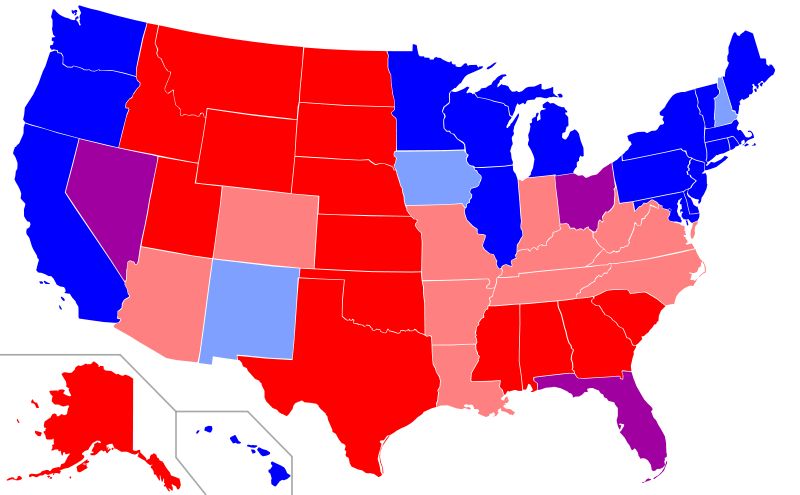
Statistical correlationsThis is a compilation of how states rank according to their voting records, faith, beliefs, etc., from polls and research, and their possible relations to each other. List of states at left are according to number of evangelicals according to Pew Research 2008 (p. 103). NOTE that consistent with what was the historical norm, but was changed by the liberal media, in my state voting stats REPUBLICANS are in BLUE, and DEMOCRATS are in RED (which I think it is more befitting to their Communist/Socialists type leanings — not that the Republicans are the kingdom of God or our salvation either). Note that from approx #26-#29 may often be swing states.More national stats on the spiritual, etc. State of the Union here.Rankings (1,2,3...) mostly by this author (could have slight errors). Click on the word "rank" to see the sources. Duplicate percentages = same rank, thus highest rank less than 50. Press F11 key on most browsers for full screen viewing. PDF download here. |
|
||||||||||||||||||||||||||||||||||||||||||||
Rank: according to % Evangelical Protestants(due to how evangelicals are categorized [2008], I think these figures can have a larger margin of error). |
Rank per % of Republican vote in last 5 Pres. elections (prior to 2012).BLUE =RED = |
Rank 2012 Presidential election, according to % of vote for Romneyvs. Obama |
Rank:according to % of all Protestants (up to 46) |
Rank according to % of Catholics(up to 42) |
Rank10 most liberal(2004) |
RankS. Baptist10 largest %1990 (?) |
Rank according to Importance of religion(up to 48) |
Rank according to % of Agnostic/Atheist(up to 44 ) |
Rankaccording “Happiness “(but see basis) |
Rank per median household income |
Rank% of income to charity. 2008*
|
|
|||||||||||||||||||||||||||||||||
|
Oklahoma (53%) |
6 |
3 (67%/33%) |
4 (75.6%) |
36 (9.7%) |
|
3 |
9 (75%) |
37 (9.6%) |
20 |
45 ($42,822) |
11 |
|
|||||||||||||||||||||||||||||||||
|
Arkansas (53%) |
25 |
7 (61%/37%) |
3 (78.2%) |
39 (7.8%) |
|
7 |
6 (78%) |
42 (6.9%) |
17 |
48 ($38,815) |
7 |
|
|||||||||||||||||||||||||||||||||
|
Tennessee (51%) |
19 |
11 (60%/39%) |
3 (78.2%) |
40 (7.7%) |
|
4 |
4 (79% |
38 (7.7%) |
4 |
43 ($43,614) |
4 |
|
|||||||||||||||||||||||||||||||||
|
Alabama (49%) |
9 |
6 (61%/38%) |
2 (80.2%) |
41 (6.7%) |
|
2 |
2 (82%) |
43 (6.8%) |
9 |
46 ($42,666) |
3 |
|
|||||||||||||||||||||||||||||||||
|
Kentucky (49%) |
15 |
8 (61%/38%) |
9 (70.2%) |
33 (13.6%) |
|
5 |
11 (74%) |
33 (10.7%) |
35 |
47 ($41,538) |
15 |
|
|||||||||||||||||||||||||||||||||
|
Mississippi (47%) |
11 |
16 (56%/44%) |
1 (81%) |
42 (6.0%) |
|
1 |
1 (85%) |
44 (5.8%) |
6 |
50 ($37,790) |
2 |
|
|||||||||||||||||||||||||||||||||
|
S. Carolina (45%) |
13 |
20 (55%/44%) |
5 (75.2%) |
38 (8.8%) |
|
6 |
3 (80%) |
34 (10.7%) |
8 |
40 ($44,625) |
5 |
|
|||||||||||||||||||||||||||||||||
|
N. Carolina (41%) |
18 |
24 (51%/48%) |
6 (73.2%) |
34 (11%) |
|
9 |
8 (76%) |
38 (9.1%) |
12 |
36 ($46,549) |
9 |
|
|||||||||||||||||||||||||||||||||
|
Georgia (38%) |
17 |
23 (53%/45%) |
7 (72.1%) |
35 (10.7) |
|
8 |
7 (76%) |
35 (9.8%) |
19 |
23 ($50,861) |
8 |
|
|||||||||||||||||||||||||||||||||
|
Missouri (37%) |
28 |
22 (54%/44%) |
11 (63.7%) |
27 (17.1%) |
|
|
15 (68%) |
22 (13.3%) |
38 |
35 ($46,867) |
26 |
|
|||||||||||||||||||||||||||||||||
|
West Virginia (36%) |
24 |
5 (63%/36%) |
8 (71.9%) |
38 (8.9%) |
|
|
12 (71%) |
28 (12.6%) |
34 |
49 ($37,989) |
38 |
|
|||||||||||||||||||||||||||||||||
|
Texas (34%) |
10 |
15 (57%/41%) |
18 (57.8%) |
14 (26.3%) |
|
|
11 (74%) |
36 (9.7%) |
16 |
27 ($50,043) |
13 |
|
|||||||||||||||||||||||||||||||||
|
Indiana (34%) |
16 |
21 (54%/44%) |
12 (63%) |
26 (18.8%) |
|
|
19 (68%) |
27 (12.6%) |
47 |
32 ($47,966) |
21 |
|
|||||||||||||||||||||||||||||||||
Louisiana (31%) |
21 |
14 (58%/41%) |
19 (57%) |
7 (33%) |
|
|
5 (78%) |
40 (7.2%) |
1 |
41 ($43,733) |
12 |
|
|||||||||||||||||||||||||||||||||
|
Virginia (31%) |
2 |
27 (48%/51%) |
10 (67.6%) |
32 (13.8%) |
|
10 |
16 (68%) |
29 (12.3%) |
28 |
8 ($61,233) |
14 |
|
|||||||||||||||||||||||||||||||||
|
Oregon (30%) |
35 |
37 (43%/54%) |
28 (51.3%) |
31 (14.8%) |
|
|
45 (53%) |
1 (24.6%) |
30 |
26 ($50,169) |
20 |
|
|||||||||||||||||||||||||||||||||
|
Kansas (29%) |
7 |
10 (60%/38%) |
13 (63.3%) |
25 (20.1%) |
|
|
13 (70%) |
31 (11%) |
32 |
25 ($50,177) |
16 |
|
|||||||||||||||||||||||||||||||||
|
Wyoming (26%) |
3 |
2 (69%/28%) |
24 (54%) |
31 (14.3%) |
|
|
36 (58%) |
14 (16.1%) |
13 |
19 ($53,207) |
31 |
|
|||||||||||||||||||||||||||||||||
|
Montana (26%) |
14 |
17 (55%/42%) |
25 (54.7%) |
23 (21.6%) |
|
|
40 (56%) |
12 (16.6% |
7 |
42 ($43,654) |
37 |
|
|||||||||||||||||||||||||||||||||
|
Ohio (26%) |
29 |
26 (48%/50%) |
17 (60.3%) |
24 (21.2% |
|
|
25 (65%) |
27 (12.7%) |
44 |
31 ($47,988) |
36 |
|
|||||||||||||||||||||||||||||||||
|
Florida (25%) |
27 |
25 (50%/49%) |
25 (53.3%) |
18 (24.4%) |
|
|
23 (65%) |
26 (12.8%) |
3 |
33 ($47,778) |
19 |
|
|||||||||||||||||||||||||||||||||
|
Washington (25%) |
38 |
38 (43%/55%) |
27 (52.1%) |
28 (16.9%) |
|
|
46 (52%) |
3 (21.8%) |
36 |
10 ($58,078) |
33 |
|
|||||||||||||||||||||||||||||||||
|
New Mexico (25%) |
33 |
36 (43%/53%) |
35 (44.3%) |
9 (30.3%) |
|
|
21 (66%) |
15 (15.7%) |
24 |
44 ($43,508) |
22 |
|
|||||||||||||||||||||||||||||||||
|
North Dakota (24%) |
8 |
12 (59%/39%) |
14 (61.3%) |
12 (27.4%) |
|
|
18 (68%) |
41 (7.1%) |
25 |
39 ($45,685) |
43 |
|
|||||||||||||||||||||||||||||||||
|
South Dakota (12) |
12 |
13 (58%/40%) |
15 (60.7%) |
24 (20.2%) |
|
|
17 (68%) |
21 (13.4%) |
15 |
38 ($46,032) |
35 |
|
|||||||||||||||||||||||||||||||||
|
Wisconsin (24%) |
32 |
32 (46%/53%) |
30 (49.3%) |
6 (32.2%) |
|
|
31 (61%) |
21 (13.4%) |
29 |
21 ($52,094) |
44 |
|
|||||||||||||||||||||||||||||||||
|
Michigan (24%) |
37 |
34 (45%/54%) |
22 (54.1%) |
19 (24.3% |
|
|
29 (64%) |
16 (15.4%) |
48 |
30 ($48,591) |
23 |
|
|||||||||||||||||||||||||||||||||
|
Iowa (24%) |
31 |
30 (47%/52%) |
16 (60.6%) |
19 (24.3%) |
|
|
26 (64%) |
32 (10.9%) |
31 |
29 ($48,980) |
40 |
|
|||||||||||||||||||||||||||||||||
|
Arizona (23%) |
20 |
19 (55%/44%) |
33 (46.5%) |
17 (24.7%) |
|
|
34 (61%) |
11 (17.2%) |
5 |
22 ($50,958) |
18 |
|
|||||||||||||||||||||||||||||||||
|
Colorado (23%) |
26 |
29 (47%/51%) |
29 (49.5%) |
21 (22.6%) |
|
|
37 (57%) |
8 (19.2% |
21 |
13 ($56,993) |
30 |
|
|||||||||||||||||||||||||||||||||
|
Idaho (22%) |
2 |
4 (65%/33%) |
34 (45%) |
30 (15.1%) |
|
|
33 (61%) |
13 (16.5%) |
14 |
34 ($47,576) |
6 |
|
|||||||||||||||||||||||||||||||||
|
Nebraska (21%) |
4 |
9 (61%/38%) |
18 (69.9%) |
16 (24.9%) |
|
|
20 (67%) |
35 (9.8%) |
33 |
28 ($49,693) |
32 |
|
|||||||||||||||||||||||||||||||||
|
Minnesota (21%) |
36 |
35 (45%/53%) |
24 (53.9%) |
10 (28.9%) |
|
|
27 (64%) |
30 (11.9%) |
26 |
12 ($57,288) |
34 |
|
|||||||||||||||||||||||||||||||||
|
Illinois (19%) |
44 |
39 (41%/57%) |
30 (48.3%) |
8 (31.4%) |
|
|
28 (64%) |
24 (13%) |
45 |
16 ($56,235) |
29 |
|
|||||||||||||||||||||||||||||||||
|
Pennsylvania (18%) |
34 |
28 (47%/52%) |
23 (54%) |
11 (28.7%) |
|
|
22 (65%) |
32 (10.9%) |
41 |
24 ($50,713) |
39 |
|
|||||||||||||||||||||||||||||||||
|
California (18%) |
42 |
44 (39%/59%) |
38 (39.6%) |
7 (31.8%) |
1 |
|
39 (57%) |
9 (18.3%) |
46 |
9 ($61,021) |
25 |
|
|||||||||||||||||||||||||||||||||
|
Delaware (15%) |
41 |
43 (40%/57%) |
20 56.5%) |
18 (24.4%) |
|
|
30 (61%) |
20 (13.8%) |
22 |
11 ($57,989) |
27 |
|
|||||||||||||||||||||||||||||||||
|
Maine (15%) |
40 |
40 (41%/56%) |
32 (47.6%) |
15 (26.1) |
4 |
|
48 (48%) |
23 (13.2) |
10 |
36 ($46,581) |
49 |
|
|||||||||||||||||||||||||||||||||
|
Maryland (15%) |
45 |
46 (37%/62%) |
21 (54.9%) |
22 (21.9%) |
3 |
|
24 (65%) |
26 (12.8%) |
40 |
1 ($70,545) |
10 |
|
|||||||||||||||||||||||||||||||||
|
D. of Columbia (15%) |
|
51 (7%/91%) |
24 (54.1%) |
30 (15.1%) |
|
|
32 (61%) |
10 (18.1%) |
37 |
$57,936.00 |
|
|
|||||||||||||||||||||||||||||||||
|
Nevada (13%) |
23 |
33 (46%/52%) |
37 (40.7%) |
13 (26.7%) |
|
|
43 (54%) |
7 (19.4%) |
39 |
15 ($56,361) |
41 |
|
|||||||||||||||||||||||||||||||||
|
New Jersey (12%) |
39 |
41 (41%/58%) |
41 (35.1%) |
4 (42.6%) |
|
|
35 (60%) |
34 (10.5%) |
49 |
2 ($70,378) |
42 |
|
|||||||||||||||||||||||||||||||||
|
New Hampshire (11%) |
30 |
31 (46%/52%) |
40 (36.7%) |
5 (34%) |
|
|
49 (46%) |
6 (20.5%) |
27 |
7 $63,731) |
50 |
|
|||||||||||||||||||||||||||||||||
|
New York (11%) |
48 |
47 (36%/62%) |
42 (34.6%) |
5 (38.4%) |
5 |
|
41 (56%) |
19 (13.9%) |
51 |
17 ($56,033) |
17 |
|
|||||||||||||||||||||||||||||||||
|
Massachusetts (11%) |
50 |
45 (38%/61%) |
44 (28.4%) |
2 (46.1%) |
2 |
|
48 (48%) |
14 (16.1%) |
43 |
6 ($65,401) |
47 |
|
|||||||||||||||||||||||||||||||||
|
Vermont (11%) |
46 |
49 (31%/67%) |
36 (42.4%) |
14 (26.3%) |
|
|
51 (42%) |
2 (23.6%) |
18 |
20 ($52,104) |
48 |
|
|||||||||||||||||||||||||||||||||
|
Connecticut (10%) |
43 |
42 (40%/59%) |
43 (34%) |
3 (42.7%) |
6 |
|
42 (55%) |
17 (14.8%) |
50 |
3 ($68,595) |
45 |
|
|||||||||||||||||||||||||||||||||
|
Rhode Island (10%) |
49 |
48 (37%/63%) |
45 (25.5%) |
1 (52.5%) |
6 |
|
45 (53%) |
18 (14%) |
42 |
18 ($55,701) |
46 |
|
|||||||||||||||||||||||||||||||||
|
Utah (7%) |
1 |
1 (73%/25%) |
46 (13.4%) |
37 (9.6%) |
|
|
14 (69%) |
25 (12.9%) |
23 |
14 ($56,633) |
1 |
|
|||||||||||||||||||||||||||||||||
|
Hawaii N/A |
47 |
50 (28%/71%) |
39 (37.8%) |
20 (22.8%) |
|
|
37 (57%) |
5 (21%) |
2 |
5 ($67,214) |
24 |
|
|||||||||||||||||||||||||||||||||
|
Alaska N/A |
5 |
18 (55%/42%) |
22 (54.1%) |
29 (15.5%) |
|
|
47 (51%) |
4 (21:4%) |
11 |
4 ($68,460) |
28 |
|
|||||||||||||||||||||||||||||||||
|
Compiled from Fox News data and the Huffington Post ** Based on itemized charitable contributions as a share of income after excluding taxes, housing, and other necessities. Information is taken from tax returns of people who earned at least $50,000 in 2008A different study which ranks states according to the amount of charitable income given is here. Notes: “Happiness” data derived from two data sets. One included subjective personal reports of happiness, while the other included objective measures, such as state population density, air quality, home prices + other factors known to normally impact quality of life. However, the latter method would not necessarily denote the happiest people. Miscl. data: Massachusetts had the highest percentage of Catholics at 36 percent, New York, Illinois and New Hampshire also had 50 or more Catholic legislators: http://www.census.gov/compendia/statab/cats/population/religion.html. The Happiness rating: http://www.livescience.com/culture/091217-happy-state-list.html. Of additional interest may be the massive U.S. Religious Landscape Survey: http://religions.pewforum.org/reports. Also Barna Poll on U.S. Religious Belief – 2001 http://www.adherents.com/misc/BarnaPoll.html. PDF download of this page here.
|
|
||||||||||||||||||||||||||||||||||||||||||||
|
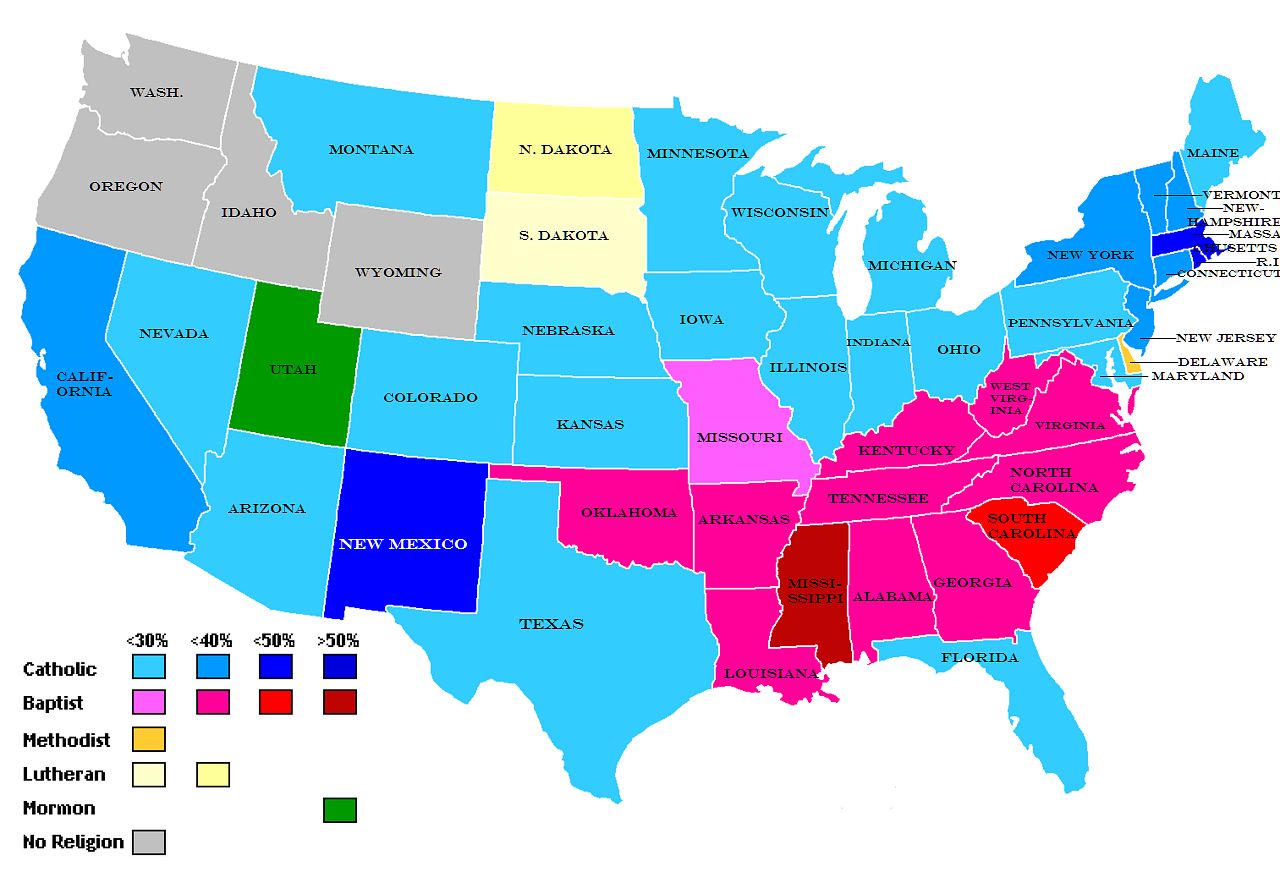
Below, most common religious affiliations in the 48 contiguous U.S. States (from Wikipedia), based on the American Religious Identification Survey; (click on X if not visible,
|
|
||||||||||||||||||||||||||||||||||||||||||||